
Reimagine a More Transparent, Accountable and Business-Building Marketplace.
The marketing world offers more innovation and opportunities than ever before. VAB is here to help make sense of it all by simplifying the complex and discovering new insights to transform how you drive business growth.
You have questions. We have answers.
Get immediate access to our Insights library.
Your Marketing FAQs Answered
Streaming, converged TV, advanced measurement, driving outcomes, ad innovation, small business & local advertising, cinema ads and more

Answers to Over 30 Commonly Asked Marketing Questions
View the answers

Trending Questions, Answered
Current Q&AGrab & Go Slides
Charts you can quickly grab for presentations. Filled with the latest stats and data, expertly analyzed
Get the charts
50+ Grab & Go Insights Charts
Get the chartsYou have questions. We have answers.
Get immediate access to our Insights library.
VAB IN ACTION
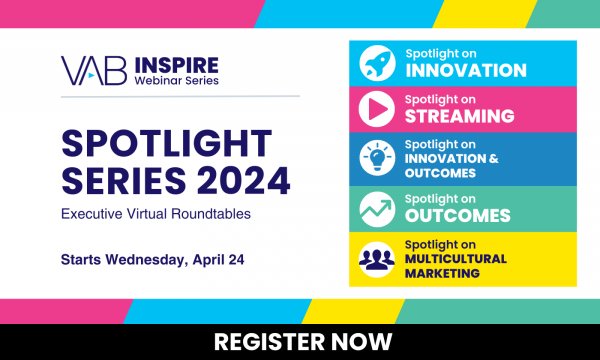
Spotlight Series 2024 | Executive Roundtable Webinars | Register Now!
Save Your Spot! Mastering the Art: Optimizing Marketing Impact with Premium Video. 5/22 @12pmET
Learn MoreThe Latest
-

Marketing Brew: Pause ads pay off on streaming, according to VAB research
About half of viewers have taken action upon seeing a pause ad, according to VAB's new report on "6 Key Ingredients to Streaming Success."
Learn More -
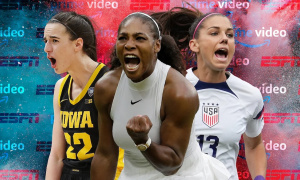
The Wrap: The Rise of Women’s Sports Isn’t a Moment, It’s a Movement | Analysis
Danielle DeLauro, VAP EVP, speaks to The Wrap: "When women are represented in the sports media coverage, and the athletes are given the same level of respect and attention as the men — you see that audiences tune in."
Learn More -
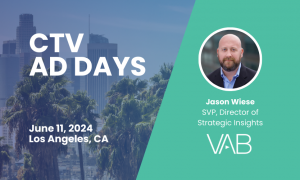
Hear from VAB's Jason Wiese at 2024 CTV Ad Days | June 11 in Los Angeles, CA
Jason Wiese, SVP, Director of Strategic Insights at VAB, will join the 2024 CTV Ad Days conference and speak on the rise of short-form advertising. Registrations now open!
Learn More -

Join VAB at the StreamTV Show | June 24 in Denver, CO
Reed Kiely, Director, Data Insights & Trends at VAB, will join the 2024 StreamTV Show in Colorado and speak on driving viewer acquisition, engagement, and growth strategies. Registrations now open!
Learn More -

VAB Unveils New Research and Guidance on the Growth Drivers of Streaming Video
As seen on Yahoo Finance: VAB guide outlines six key ingredients for a successful streaming campaign.
Learn More -
Watch Now | Measure Up: A Data + Tech-First Approach to Navigating the Complex Advertising Ecosystem
On demand webinar: Experts from VideoAmp and VAB unpack the modern approach to measuring audiences across platforms.
Learn More -

Digiday: How outcome-based measurement may figure into this year’s upfront market
The consideration of full-funnel business outcomes is at an "all-time high" this upfront season, VAB President and CEO Sean Cunningham tells Digiday.
Learn More -

The recipe for streaming profitability: Balancing revenue and costs like a chef
In a new op-ed, VAB's Danielle DeLauro shares the secret ingredients streaming platforms need to be successful.
Learn More
Trusted by


VAB Insights library
Dive into our collection of over 300 original reports, inspired by questions from marketers just like you. Whether you’re seeking answers to your marketing stategy questions or curious about the latest industry trends, come explore with us.
10 Acts of Attention By a Moviegoer
Reel in audiences of blockbuster ad attentiveness
Learn More
The Latest Insights